
Nashville Modern Excel & Power BI User Group
Come join us at the Nashville Modern Excel & Power BI User Group, as we meet every month to discuss the latest news and learn more about the Power Platform, Excel, and even a little bit of Azure. Check out our official Power BI User Group page and be sure to register for our next event at our Meetup page.

Data/AI Solutions Architect & Process Automation Specialist
How to Reduce Your Capacity Usage in Microsoft Fabric - Best Practices
This lecture delivers actionable strategies for mastering Microsoft Fabric costs by optimizing both storage and compute (CU) consumption. We will demonstrate how applying architectural best practices and improving workload efficiency directly translates into significant cost savings. You will gain robust guidance for designing and operating financially sustainable and high-performing data solutions on the Fabric platform.
It's a Data Holiday Party!
Come hang out and ring in the holidays at the annual Nashville Data Community Holiday Party.
YOU MUST REGISTER AT THIS LINK: https://luma.com/10csrhd0
Vaco is kind enough to sponsor, so come out, have some food and drink, talk data, and get to know your fellow tech folk from Middle Tennessee.
(Data Christmas sweater optional)
We are excited to have all of these groups involved
Data Science Nashville Meetup
Data Nerds
Data Engineering Group
Power BI Users Group
Nashville AI and ML
Artificial Intelligencers
AI Tinkerers
AI Engineers
Data Gen Initiative


Data analytics expert in Power BI & Microsoft Data Stack
Supercharge Your Power BI Development with AI, Agents, and MCPs
Unlock the next level of Power BI development with the latest AI tools—ChatGPT, Copilot, MCPs, and beyond. This session explores how AI is reshaping every stage of the Power BI lifecycle, from design to delivery, and introduces cutting-edge advancements like model context protocols (MPCs) and autonomous AI agents.
Learn how AI now empowers Power BI developers to:
Accelerate DAX creation and troubleshooting with context-aware suggestions tailored to complex calculations.
Demystify data modeling challenges, including filter context, relationships, and performance bottlenecks, through AI-guided recommendations.
Design impactful visuals and data stories, leveraging AI to generate layouts, narratives, and presentation-ready insights aligned to your audience.
Streamline repetitive workflows with AI agents that can build reports, publish to the Power BI Service, optimize models, and summarize insights autonomously.
Orchestrate end-to-end development with MPCs, chaining together AI tasks across multiple tools and modalities to deliver smarter, faster BI solutions.
Enhance governance and documentation, with AI automating report descriptions, data lineage mapping, and compliance-ready outputs.
Whether you’re new to Power BI or a seasoned expert, discover how AI is transforming BI development from reactive problem-solving to proactive, intelligent automation—helping you work smarter, deliver faster, and drive real business impact.

Microsoft Data Platform MVP | Speaker | Data Engineering | Power BI | Lifelong Learner
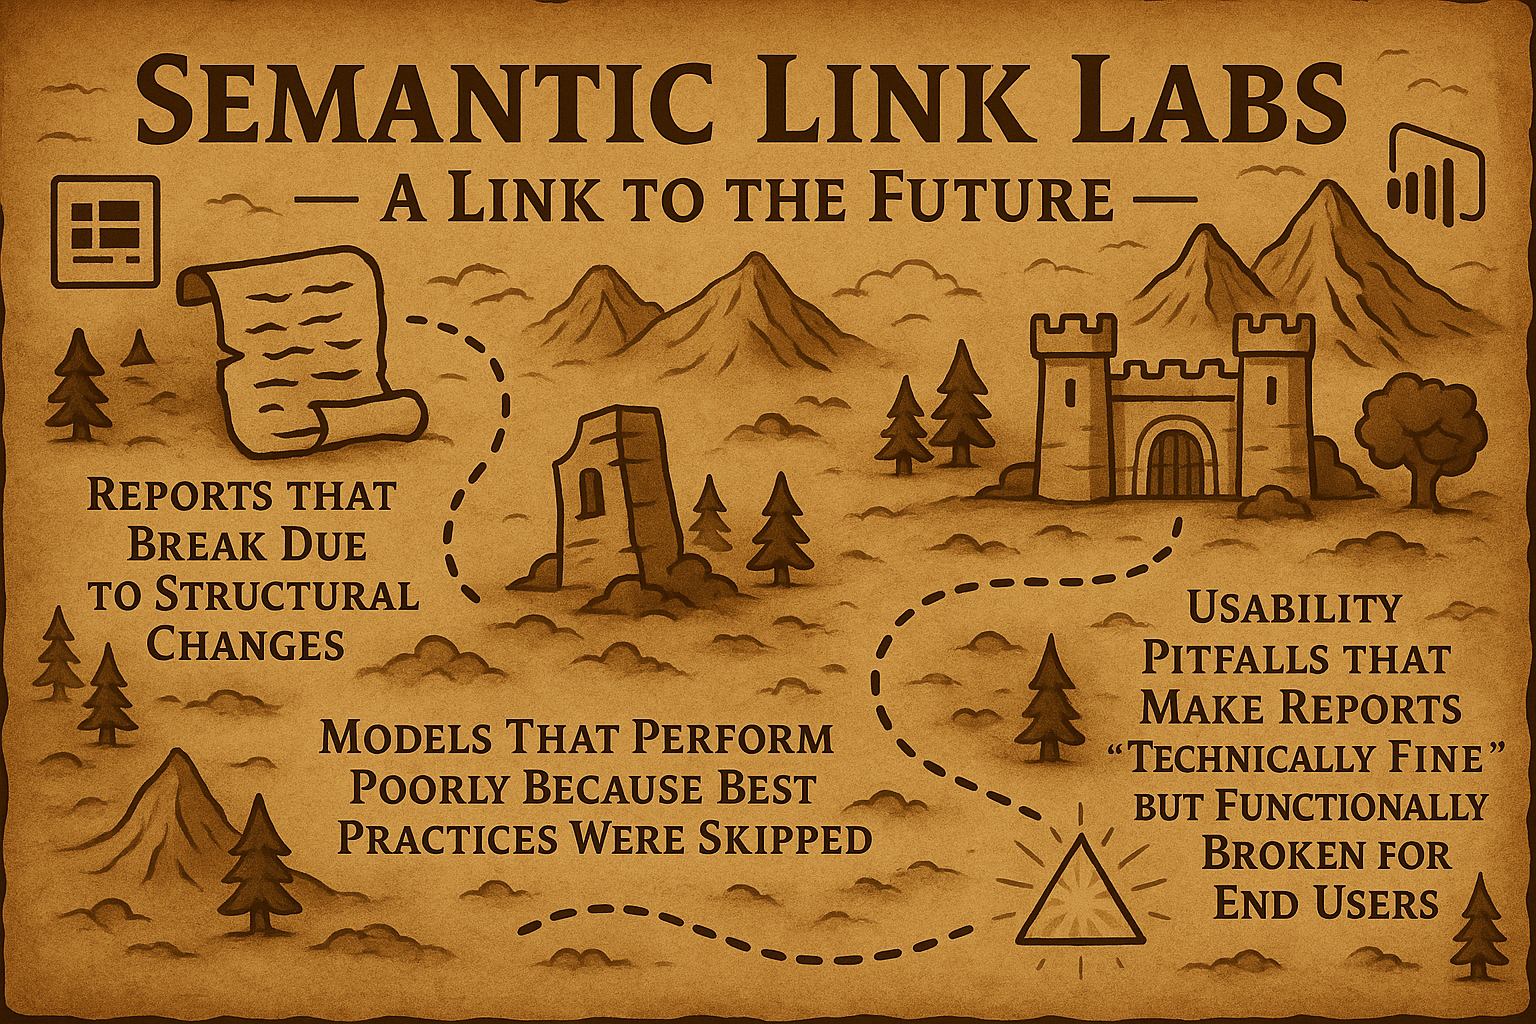
Semantic Link Labs: A Link to the Future
It’s dangerous to go alone—take Semantic Link Labs!
When users are the first to discover that a Power BI report is broken, the damage is already done. Trust is lost, adoption slows, and credibility suffers. Instead of wandering into these traps unprepared, what if you had the Master Sword in hand—ready to defeat broken models and guard against treacherous usability pitfalls? That’s the power of Semantic Link Labs.
In this session, we’ll set out on a quest through Microsoft Fabric notebooks and pipelines, using Semantic Link Labs as our weapon and shield against unreliable reports. Along the way, we’ll face down the “mini-bosses” of BI development:
Reports that collapse due to structural changes
Models that underperform because best practices were skipped
Usability pitfalls that make reports “technically fine” but functionally broken for end users
You’ll learn how to install and configure Semantic Link Labs, explore its legendary features, and see how it integrates seamlessly into Fabric. We’ll then take it a step further, automating health checks and governance with notebooks and pipelines—turning one-time fixes into repeatable spells.
By the end of this adventure, you’ll uncover your own “Triforce of Best Practices”—a report that tracks the best practices of all semantic models in your environment. You’ll leave equipped with a map, a shield, and the Master Sword itself: the tools you need to keep your BI world in legendary shape, where broken reports are discovered early, performance issues are vanquished, and best practices reign supreme.


Director, Microsoft Solutions | Microsoft MVP
Power Query Lint: Enhancing M Code Performance and Quality
Power Query Lint is an innovative web-based tool aimed at improving the quality, readability, and performance of Power Query M code, which is essential for data transformation tasks in Power BI, Excel, and Microsoft Fabric. This presentation will introduce attendees to the tool's capabilities, including its ability to detect syntax errors, deprecated functions, inefficient patterns, and formatting inconsistencies. By identifying potential issues early in the development cycle, Power Query Lint helps developers adhere to best practices, thereby enhancing the maintainability and performance of their data transformation queries.
In addition to its interactive web interface, Power Query Lint provides an API that facilitates automated linting workflows and seamless integration into CI/CD pipelines. This functionality supports continuous code quality checks and aligns with DataOps principles by promoting automation, collaboration, and rapid feedback in data pipeline development and maintenance. Through live demonstrations and real-world examples, attendees will learn how to leverage these features to write cleaner, more efficient Power Query code with increased confidence and automation.
Speaker
Director, Microsoft Solutions | Microsoft MVP
Power Query Lint is an innovative web-based tool aimed at improving the quality, readability, and performance of Power Query M code, which is essential for data transformation tasks in Power BI, Excel, and Microsoft Fabric. This presentation will introduce attendees to the tool's capabilities, including its ability to detect syntax errors, deprecated functions, inefficient patterns, and formatting inconsistencies. By identifying potential issues early in the development cycle, Power Query Lint helps developers adhere to best practices, thereby enhancing the maintainability and performance of their data transformation queries.
In addition to its interactive web interface, Power Query Lint provides an API that facilitates automated linting workflows and seamless integration into CI/CD pipelines. This functionality supports continuous code quality checks and aligns with DataOps principles by promoting automation, collaboration, and rapid feedback in data pipeline development and maintenance. Through live demonstrations and real-world examples, attendees will learn how to leverage these features to write cleaner, more efficient Power Query code with increased confidence and automation.


Data-Driven Product Lead | Power BI Specialist
The Power BI Glow-Up: Watch a Report Transformation Live
Do your Power BI reports feel functional but lack visual appeal? It’s time for a glow-up! Great data storytelling isn’t just about numbers—it’s about how you present them. This session will equip you with UI/UX best practices, design hacks, and practical tips to elevate your reports from basic to breathtaking.
Who Is It For?
This session is for Power BI users who want better-looking reports, Data pros who care about clarity and impact and for anyone who loves good design + great data!
Session Takeaways:
1. Quick design fixes for instant improvements
2. Smart visual choices for better storytelling
3. Color, layout & formatting tips that work
4. Before-and-after transformations to apply instantly
Walk away with practical, easy-to-apply hacks to give your reports a serious glow-up!
Speaker
Data-Driven Product Lead | Power BI Specialist
Meet our data pro and Microsoft Certified Power BI specialist! She’s all about turning raw data into cool, actionable insights. With her deep knowledge of Power BI's advanced features, she's famous for her creative and innovative reports that really make data pop. She is also one of the four Finalists of the Microsoft Power BI DataViz World Championships 2025.
As a Product Lead, she does it all- market research, testing, collaborating with teams, brainstorming new ideas, helping with marketing, and creating engaging content.
She’s also an engaging speaker and loves sharing her knowledge with the data community on her Medium blog, offering tips and best practices. Passionate about diversity and inclusion, she mentors aspiring pros, especially women, to help them reach their full potential in the data field.
When she’s not diving into data, she’s a proud Corgi paw parent who loves outdoor adventures and trying new foods as a dedicated foodie.


Microsoft Data Platform MVP, Independent BI/DBA Consultant
Tips and Tricks for Microsoft Fabric Data Warehouse
Microsoft Fabric offers a SQL-based data warehousing experience to complement its lakehouse capabilities. While in time this may provide a simple lift-and-shift option for our on-premises or Azure SQL Database data warehouses, the reality is we're not quite there yet.
In this session we'll discuss some tips and tricks for getting the most out of your Fabric Data Warehouse. We'll cover the issues preventing that straight lift-and-shift, and talk about ways to mitigate or sidestep them. We'll also look at some best practices for design patterns and high performance in your warehouse.
This session is designed for developers, engineers, and their managers to quickly get up to speed with this brand new technology.
Speaker
Chris Hyde (he/him) is a Microsoft Data Platform MVP based in Albuquerque, New Mexico. He works as an independent SQL Server BI and DBA consultant and is the leader of the Albuquerque local Azure Data Technologies group. He loves loud music and cricket, but not usually at the same time.


Senior Business Intelligence Analyst, Community Health Network
Power BI Directory: A Solution to a Common Problem
A common challenge that many companies face is not knowing all the Power BI data reports that are available and how to access/request access. The solution to this problem is a Power BI Directory, a comprehensive tool designed to help users navigate and utilize PowerBI effectively. This app is available to all users within our network and provides information on data availability, user permissions, analytics support, as well as access guides and resources to enhance the user's PowerBI skills. The app also features information specifically for Power BI developers to help drive Power BI improvements throughout the network.
The Power BI Directory was put in place 4 years ago and continues to be one of the most utilized Power BI Apps in our network. During this session, we’ll discuss the design of the Power BI Directory and how this single solution has solved many problems.
Miranda Grant has been a Senior Business Intelligence Analyst at Community Health Network since 2018. Prior to this role she worked as an Infection Preventionist/healthcare worker for 10+ years and has a master's degree in public health with a concentration in epidemiology. She is certified in Power BI and loves working with large data. She has been married for 10 years, has two daughters, and a greyhound puppy.


Co-Founder, Pathfinder Data Strategy

Liam Payne
Database Administrator, BoomTown
Data Project Meltdown: Technical and Human Factors
Data projects often struggle due to both technical limitations and organizational challenges. While Microsoft’s data stack provides powerful tools, gaps in functionality, project misalignment, and inefficient workflows can lead to stalled progress and unmet expectations.
In this talk, we’ll examine common obstacles teams face when working with Microsoft’s ecosystem, including:
- Technical Limitations
- Limited Source Control
- Project management pitfalls
- The prioritization challenge
Understanding these challenges—and how to address them with pragmatic and adaptable approaches—can help teams deliver more effective and sustainable data projects.
Antone Christianson-Galina and Liam Payne
Antone has seven years of experience bridging the needs of business users and data teams. Having been part of FP&A, analytics, and development teams, he excels at turning business requirements into code. On the technical side, he has deep experience with front-end Microsoft solutions, managing business logic in a semantic model, and team/project management experience with Azure DevOps using source control and CI/CD. He has created 100+ data visualizations and managed a team of 3 developers. Antone is very involved in Nashville’s BI community and presents extensively, including at the Nashville Analytics Summit.
Liam has 11 years of experience working with SQL Server and Microsoft Data Technologies, specializing in performance and query tuning, process automation and optimization, data integrations, and data architecture. He has expansive knowledge of ingesting and working with data sets focused on healthcare (EMRs, CMS, RX Norm, Claims, Billing Systems), real estate, finance, accounting, and consumer retail. He has a proven track record of increasing data system efficiency and enriching output.


Jason Romans
Principal Consultant, P3 Adaptive
Enhancing Power BI Development: It is fun to stay at the T-M-D-L
TMDL (Tabular Model Definition Language) is crucial for efficient Power BI development using code. With the new TMDL view in Power BI Desktop, you can use it as your canvas to quickly create and modify semantic model objects. Go beyond what is possible in the Power BI Desktop UI and generate and modify semantic objects that previously would have required a third-party tool. Imagine pulling in standardized reusable scripts that benefit you and your teammates.
We will start our stay by learning about TMDL and how it differs from other scripting languages. We will learn the syntax and common missteps. We will examine how the TMDL view ties in with the Power BI project and how to choose which to use and when.
We will look at the support for TMDL in other tools such as Tabular Editor and Visual Studio Code. One of the benefits of TMDL is that it is text code, which means you can employ your favorite editor to develop and then apply those changes. Since TMDL is just code, we will touch on source control and how we can utilize it to detect changes between models quickly.
Lastly, we will discuss common use cases and how to leverage TMDL to become more effective and in-demand Power BI Developers.
Jason Romans is a Business Intelligence engineer in Nashville, TN working with the Microsoft Business Intelligence stack. Jason started his career as a DBA and over the years moved to working in his passion of Business Intelligence and data modeling. His first computer was a Commodore 64 and he's been hooked ever since.
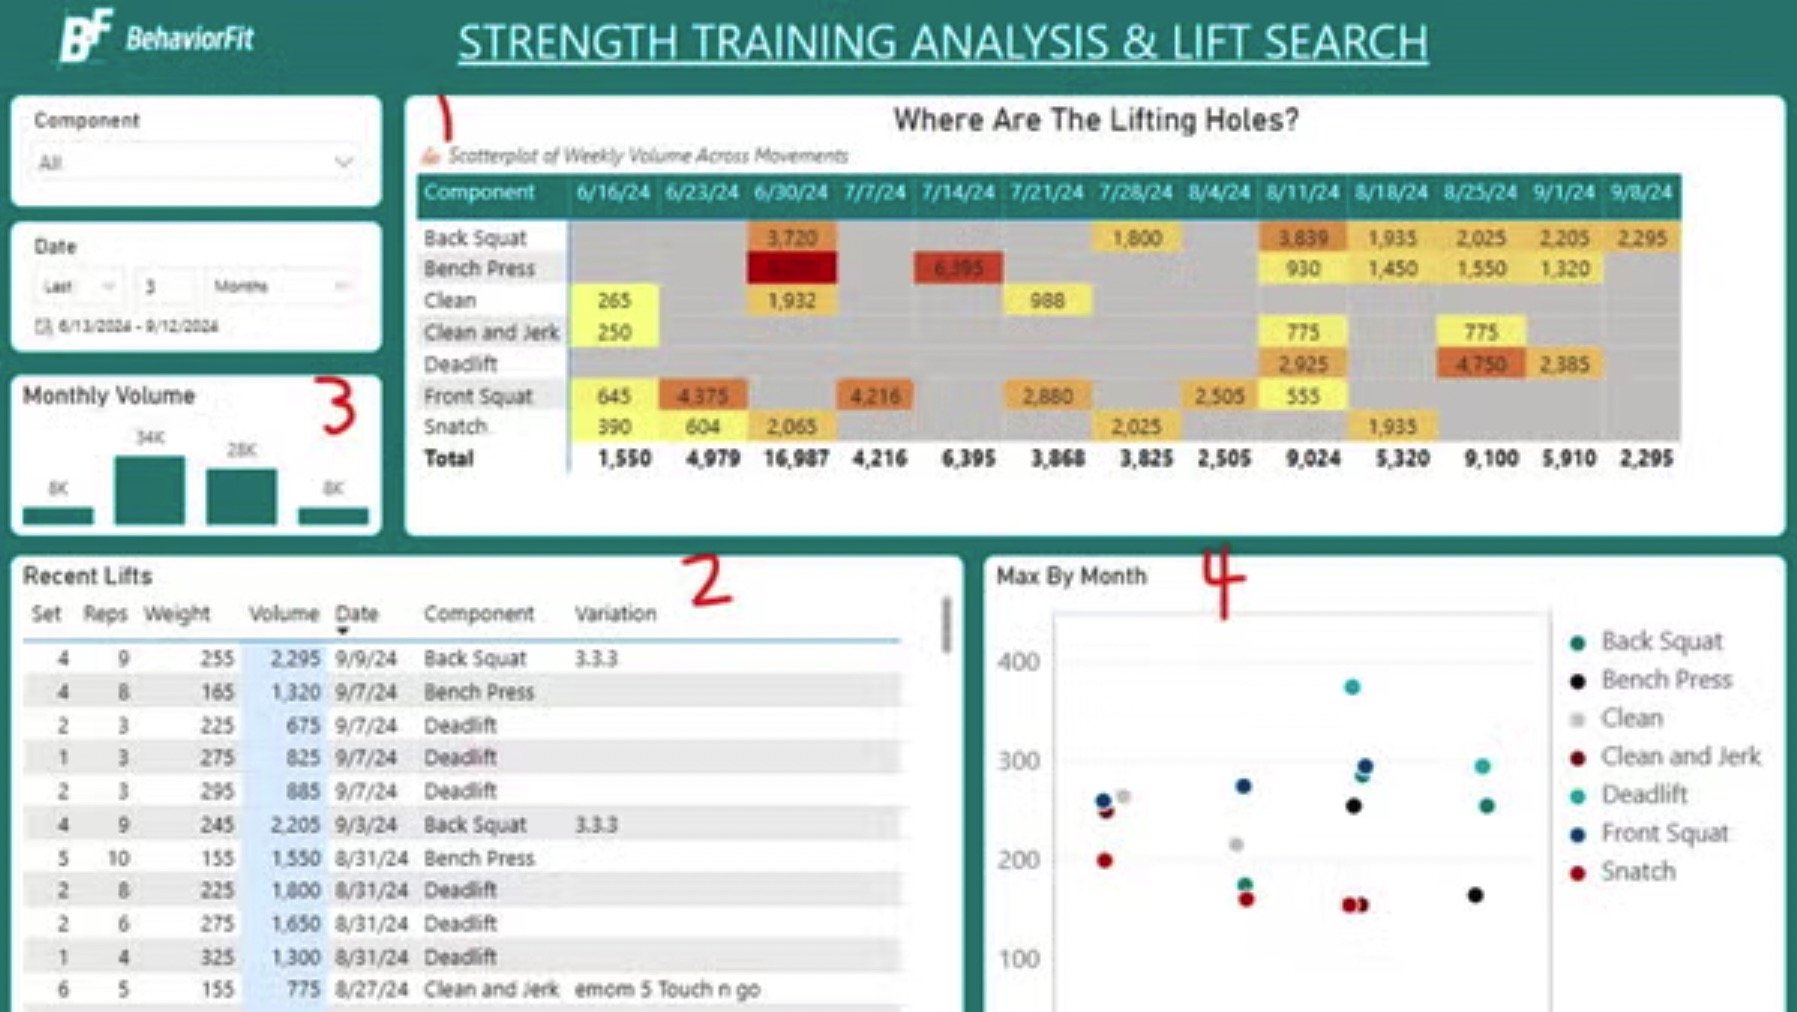
Data-Driven Fitness: Leveraging Power BI to Optimize Health Behavior Change
In this talk, I’ll explore how Power BI can be used in an innovative way to support behavior analysis (ABA) in health and fitness coaching. By leveraging Power BI's powerful data visualization and analysis tools, I track client progress, identify behavior patterns, and make data-driven decisions that enhance goal achievement. My approach integrates ABA principles with fitness metrics to create personalized reports, highlight areas of improvement, and optimize training programs. I’ll also discuss how Power BI allows for the analysis and tracking of client behaviors and interventions, ensuring a dynamic, responsive coaching process. Throughout the talk, I’ll demo unique ways I use Power BI with my clients, share innovative strategies for targeting behaviors, and present a few case studies that showcase how this approach leads to more effective, data-informed fitness coaching.
Nick Green, PHD, BCBA is the founder and CEO of BehavoiorFit. BehaviorFit is the dream for Nick. Combining health, fitness, and behavior analysis for the rest of the world. He is an entrepreneur, husband, and father.
Nick Green, is a board certified behavior analyst (BCBA) and focuses on improving the health of others through practice and research. His formal education includes:
* B.A. Psychology (Purdue University, West Lafayette, IN, 2006)
* Minor: Philosophy
* M.S. Organizational Behavior Management (Florida Institute of Technology, Melbourne, FL, 2015).
* Ph.D., Psychology (University of Florida, Gainesville, FL, 2019)
Nick’s previous experiences include 5 years of clinical work with individuals diagnosed with developmental disabilities, working within organizations to evaluate and improve processes, managing and overseeing the training of small teams.
His experience and education bring a unique perspective when designing pro-health solutions. Nick’s main focus and research interest in reducing sedentary behavior (too much sitting) in the workplace. His passion is:
“Improving human performance and health with behavior analysis.”
When Nick is not in a book or writing, he enjoys training his dog Pete, improving productivity, photography, Olympic weightlifting, and functional fitness.
Nick grew up running cross-country, wrestling, hacking at golf, and playing baseball.
Making Power BI Run Faster!!!
This session will review the areas of performance problems and helpful tools. From data refreshes to model calculations and visual rendering to data model design, performance tuning is vital to keep the attention of a report user. More than 5 or 6 seconds for a refresh can drive someone to not use a report. There are many ways to handle tuning, but it should start in the design. This is not always the case, so internal and external tools are there to guide the current developer. We will talk about query folding, minimizing data loaded as well seeing the difference between the storage and formula engines. Come join me for tuning Power BI reports and the data models.
Thomas LeBlanc is a Microsoft Data Platform MVP and has spent 15+ years as a Data Warehouse Manager and Business Intelligence Architect in Baton Rouge, LA along with 15+ year as a Database Administrator specializing in SQL Server, Microsoft Business Intelligence Services (SSIS, SSAS & SSRS) and Power BI. Starting as a COBOL while in college as Louisiana State University, he has also been a developer, report writer, trainer and documentation writer. Thomas has been a recent and frequent speaker at PASS Summit, SQLSaturday, Live360, VSLive and Power Platform events. Microsoft has recognized Thomas as a Data Platform MVP for the past 5 years.

Nashville PUG Social: It's a Data Holiday Party
Join with the Data Science Nashville Meetup, Data Nerds, Data Engineering Group, and the Power BI Users Group for a "DATA" Holiday Party. Sponsored by the Vaco Nashville, we will meet at their offices in Brentwood for drinks, food, and friendly conversation. This is event is purely social, so we won't have a formal presentation like normal. Hope to see you there!
Sponsored by Vaco Nashville
Date: December 16, 2024
Time: 6:00pm to 9:00pm
Location: 5501 Virginia Way, Suite 120, Brentwood, TN

Real-Time Analytics in Fabric
As data continues to get more attention from executives and a wider range of industries, getting data in the hands of business leaders faster and more accurately has become a common request. Real-time analytics in Fabric allows us to get data streamed to a Power BI report for your end users to consume. During this session, we will go over how to create a data source in Fabric using KQL and load that data into a Power BI report that refreshes its visuals without needing to refresh the browser. We will also look at how to create an event stream as a data source using publicly available data.

Power BI and Fabric Open Mic
This session is all about you!
What Fabric or Power BI projects have you been working on that you want to show off?
Are you stuck and need help from the community on a project?
What questions do you have about Power BI? Fabric? DAX? Power Query?
You get to help chart this course of this meeting!
All project show and tell presentations will be limited to 5 minutes to allow ample time for everyone. When completing the RSVP, please indicate if you would like to share a project


Jason Romans is a Business Intelligence engineer in Nashville, TN working with the Microsoft Business Intelligence stack. Jason started his career as a DBA and over the years moved to working in his passion of Business Intelligence and data modeling. His first computer was a Commodore 64 and he's been hooked ever since.
Power up your Fabric Development with DAX Studio and Tabular Editor
Do you have a slow Power BI report? This session will equip you with the knowledge to address the issue of slow Power BI reports.
Whether you are just starting on your Power BI Journey or an experienced Power BI developer these tools enhance your development and analysis of your data. This session will cover connecting to Power BI Desktop, Power BI Premium Workspaces, and Fabric Workspaces to meet you where you currently are. DAX Studio and Tabular Editor are part of the study guide for the DP-600 exam for Fabric, so this is the perfect time to start learning how to put them to good use.
The first tool we will look at is DAX Studio. Its strength is being able to analyze your data separately from Power BI and Fabric. You can use it to quickly gather statistics about multiple semantic models. Has a user reported that one of the reports is running slow? You can use DAX Studio to do DAX performance tuning to make it faster.
The second tool is Tabular Editor 2. It gives you the ability to check to see if your models are following best practices. You can make changes to your models whether they are running in Power BI Desktop, Power BI Premium, or Fabric Workspaces. With Tabular Editor you can use scripts to automate changes that if done manually could take days.
These are just some of the topics we will cover as we learn how valuable these tools can be. This session will have the greatest benefit to someone new to DAX Studio and Tabular Editor regardless of where you are on your Fabric journey.
Make Scorecards Great Again
Speaker: Alex Kolokolov
Problem: Managers want to see "everything at once" and it makes reports overloaded with total metrics. Also, eye-catchy gauges make no sense.
Analysts develop custom KPI solutions but they don’t meet business expectations in visualization and flexibility.
At this workshop, you will learn how to enrich your dashboards with comprehensive KPI scorecards and make them flexible for customization and self-service analytics.
Agenda
Business view
How to define actionable metrics and highlight them on a dashboard. How to enrich dashboards view KPIs and not overload them
Design view
Why gauges are useless and outdated. 3 “don’t” for KPI card background.
Color coding: how to correctly highlight deviations, unachieved and exceeded goals.
Tech view
7 evaluation criteria to select KPI widget for your project. Review of advanced visuals for Microsoft Power BI
Demo session: 5 steps to set up Multi Target KPI card, adopt it for mobile view.
Alex Kolokolov is CEO at Data 2 Speak Inc
Books author: “Data Visualization with MS Power BI”, “Make your data speak”.
Founder of international data visualization award.
Demystifying DAX: An Introduction to Data Analysis eXpressions
Welcome to the wide, wonderful world of DAX! In this introductory session, we embark on a journey through Data Analysis Expressions (DAX), the language at the heart of Microsoft Power BI, Excel Power Pivot, and Analysis Services. We'll lay out a DAX learning path, examine DAX syntax, and provide a solid foundation to know how, when, and where to leverage DAX in your data analysis journey.
Basics of Building a Data Model in Power BI
So, you want to start using Power BI. You have a couple of data sources that you want to bring in. How do you go about bringing in this data? How do you build a data model out of this data?
This can be a daunting task and one we will tackle from the beginning. First, we will look at using Power Query to bring in the data. Then we will examine how to best create the data model.
We will cover some of the best practices when developing the data model so that it scales well. One of the benefits of having a well-designed model is the DAX code can be easier to understand.

Requirements Gathering 101
No analytics, BI, or reporting effort will succeed without a great foundation. If you, the report creator, do not know what success looks like in the eyes of your stakeholders and report consumers, your reporting project is destined to fail.
In this presentation, we will begin with the basics, understanding the "why" behind the report(s) you are creating, and then explore a method I call "design backward and build forward".
Together, we will explore the process and technique of what sets a great foundation for successful analytics. Join us on March 21 to discuss how to build a great foundation for your next reporting project.

Storytelling in the Age of Big Data
In today's data-driven world, the ability to distill complex information into compelling narratives is paramount. Join us for an enlightening exploration of "Storytelling in the Age of Big Data: A Visual Perspective," where we delve into the art and science of conveying insights through powerful data visualization.
Key Highlights:
Mastering Data Visualization Techniques: Learn how to create visually stunning representations of data that engage, inform, and inspire.
Narrative Construction: Understand the nuances of crafting narratives around complex datasets, ensuring your message is clear and impactful.
Interpreting Visual Cues: Explore the psychology behind effective visual communication and how to guide your audience through your data-driven stories.
Ethical Considerations: Delve into the responsible use of data visualization and storytelling, ensuring accuracy, transparency, and privacy.
Case Studies and Best Practices: Gain insights from real-world examples and best practices from leading professionals in the field.
Tools and Technologies: Explore a diverse array of tools and technologies that facilitate seamless data visualization and storytelling, regardless of your preferred platform.
Who Should Attend:
This session is designed for data analysts, visualization specialists, storytellers, UX/UI designers, business analysts, researchers, and anyone passionate about transforming data into compelling narratives. Whether you're a seasoned professional or just starting your journey, this session offers valuable insights and practical knowledge applicable to all skill levels.
Unlock the potential of your data-driven narratives and leave with a fresh perspective on how to captivate your audience in the age of big data.

Intro to Microsoft Fabric
Microsoft Fabric is an all-in-one SaaS analytics solution combining elements from Power BI, Azure Synapse, and Azure Data Factory. In a unified platform, this combination allows users to build:
Scalable data pipelines with native connections to ~200 data sources
Machine Learning models
Data Warehouses
Data Lakehouses
Real-time analytics solutions
Power BI report and dashboards
During this talk, we'll introduce Fabric's features and capabilities. We'll also demo how to build a data pipeline, load data into Fabric's OneLake, model the data, and visualize the data with Power BI.
Power BI 101 - Connect and Transform with Power Query
This is the first session in our series to help you get started with Power BI. This session will focus on connecting to data and transforming it into an organized dataset that can be visualized in Power BI.

Dashboard Contest Presentations - 6th Annual
We hope you can join us to watch your fellow users present their dashboards in our 6th annual Excel & Power BI Dashboard Contest. You do not need to present a dashboard to come. We need people to vote, so please join us.
If you want to participate in the contest, reply to this email or message Will Harvey through meetup. Don't wait, because there are limited slots. Here are the contest rules:
Use Power BI, Excel, or Tableau to create a dashboard. (Yes, we are going mix it up and allow people to use Tableau this year!) You can share something you already made at work if you want. Just make sure you hide anything sensitive.
Tell a story with your data. We will be looking for originality and creativity.
Submit the title of your Dashboard by Tuesday Jan 17th to Will Harvey (williamharvey at gmail.com or Meetup.com message).
Present your dashboard on January 19nd meeting (~5-10 min).
The live audience will vote and we will announce the winner.
If you win, you get the bragging rights and we will share a screenshot and description of your Dashboard with our 1,000+ User Group email list.

Modern Excel with Chris Webb
If you have a long memory you'll recall that 8 years ago Microsoft BI was all about Power Pivot and Power BI in Excel. Power BI is the big thing nowadays but Excel's BI features have recently had a makeover - and in this session we'll see just how much BI you can do with the Excel you already own, without paying for Power BI or any other BI tool. As well as seeing what's new in Power Pivot and Power BI you'll see how Office Scripts can be used to automate tasks and Data Types can bring in external data.
Chris Webb is a member of the Power BI Customer Advisory Team at Microsoft. He has over 20 years of experience using Microsoft BI tools, has written several books and blogs about Microsoft BI at https://blog.crossjoin.co.uk/

Power BI: Tips and Tricks
Michael Hewitt will be presenting Power BI Tips and Tricks that he has learned over the years using Power BI and being a part of our user group.
We will be meeting both in-person and online. (Note: the Microsoft Office requires a health check so if you plan to come in person, see the details below. If that does not work for you or if you will not be able to come in person, we will provide a Zoom link for the meeting.)

Power BI & ALM: Or How to Do Version Control at Scale
If you have ever developed Power BI content with someone else or within a team, you know how difficult it can be to manage version control. Also, what if you need traceability and audit capability? This can be a crucial requirement for Sarbanes-Oxley compliance.
That said, not every team and not every Power BI solution requires the same level of rigor. In this meetup, we will explore the options for managing version conflict and being able to trace the changes you make to your Power BI content.

Power BI: Tips and Tricks
Power BI Tips and Tricks
We will be meeting both in-person and online. (Note: the Microsoft Office requires a health check so if you plan to come in person, see the details below. If that does not work for you or if you will not be able to come in person, we will provide a Zoom link for the meeting.)
ZOOM Meeting:
https://us02web.zoom.us/j/81975508982?pwd=bmkzNnJUV3U5Nmhtd2lBNFc1SDBodz09
For those in person, we will provide a free lunch.
In this meeting we will try and show 30 Power BI tips and tricks in 30 minutes! The clock is on!
IMPORTANT:
Everyone entering a Microsoft facility in the U.S. must be fully vaccinated and upload proof of their COVID-19 vaccination or attest to having an approved accommodation in HealthCheck. (For approved accommodations, please be prepared to show a negative COVID test that has been taken 7-days prior to the date of entering the office).
HealthCheck:
https://msrtw.powerappsportals.com/en-US/

Power Query Review: 10 Years Later
After a long hiatus, we are back!!
We will be meeting both in-person and online. (Note: the Microsoft Office requires a health check so if you plan to come in person, see the details below. If that does not work for you or if you will not be able to come in person, we will provide a Zoom link for the meeting.)
For those in person, we will provide a free lunch.
The topic of this meetup will be one person’s journey using Power Query for almost 10 years. We will look at the basics of Power Query, talk about the pros and cons using it in different applications, and the best way to learn more about it. Power Query is a data exploration and transformation tool in Power BI and Excel.
IMPORTANT:
Everyone entering a Microsoft facility in the U.S. must be fully vaccinated and upload proof of their COVID-19 vaccination or attest to having an approved accommodation in HealthCheck. (For approved accommodations, please be prepared to show a negative COVID test that has been taken 7-days prior to the date of entering the office).
HealthCheck:
https://msrtw.powerappsportals.com/en-US/
ZOOM Meeting Info:
We will post the Zoom link on the day of the event, so check back on this page then.
Basic Data Modeling for BI Reporting
In our BI journey, we all hit a plateau in our learning curve. One reason is that we haven't modeled our solution correctly. In order to move to the next level of our journey along the BI learning curve, we need to understand how a tool like Power BI works. Only then will we understand why we design our data models the way we do. In this session, we will review how tools like Power BI work how that impacts the way we build data models.
About: Michael McKinley is the founder of McKinley Consulting. Michael has managed data transformation projects for the last nine years. He is Microsoft Certified in Power BI and the Power Platform and has worked with major clients such as HCA, FedEx, and the United Methodist Church, among others.

Daniel Otykier Talks Tabular Editor 3: The Best Power BI Tool That Isn’t Power BI
Join us *online* as we meetup to share ideas around Power BI, Modern Excel, and the Power Platform.
After you've mastered Power BI Desktop, the most important tool for taking your data analytics career to the next level is Tabular Editor. Daniel Otykier, the creator of Tabular Editor, has just released the third full version, and it is chock full of advanced features.
If you work on Power BI datasets on a regular basis--particularly large, complex datasets with several tables, dozens or hundreds of metrics, and a lot of data--then this is the professional, enterprise-grade tool that you will need.
Daniel Otykier joins the Nashville Modern Excel & Power BI User Group to give us a walk-through of the best Power BI tool that isn't Power BI. Be sure not to miss out on this great presentation!

Fifth Annual Dashboard Contest
We hope you can join us to watch your fellow users present their dashboards in our 5th annual Excel & Power BI Dashboard Contest. You do not need to present a dashboard to come. We need people to vote, so please join us.
If you want to participate in the contest, reply to this email or message Will Harvey through meetup. Don't wait, because there are limited slots. Here are the contest rules:
• Use Power BI and/or Excel to create a dashboard. You can share something you already made at work if you want. Just make sure you hide anything sensitive.
• Tell a story with your data. We will be looking for originality and creativity.
• Submit the title of your Dashboard by Tuesday July 20th to Will Harvey (williamharvey@gmail.com or Meetup.com message).
• Present your dashboard during the July 22nd meeting (~5-10 min).
• The live audience will vote, and we will announce the winner.
• If you win, you get the bragging rights, and we will share a screenshot and description of your Dashboard with our 1,000+ User Group email list.
Thursday, June 17, 2021
11:30 AM CDT
How To Use Data Visualization To Make Better Decisions — Faster
Many organizations don’t realize how much faster and more accurate their decision-making would be if they were better at data visualization. Indeed, most organizations struggle with seeing and understanding their data. (Think about some of those 100-page slide decks and 60-column spreadsheets.)
In this live session, best-selling author and data visualization consultant Steve Wexler will share insights on how to get your organization to "get" data visualization.
Attend and learn:
Why “just the numbers” isn't good enough
The “gateway drug” to data visualization
Why we see so many bar charts
Why most people make a mess of using color
The secret to engaging your stakeholders and the power of disaggregated data
What you should always, always, always keep in mind
If you’re new to data visualization, this webinar will help you understand the benefits of well-designed charts and dashboards. If you are experienced in data visualization, this webinar will help you evangelize its use in your organization.
About: Steve Wexler is the founder of Data Revelations, co-author of The Big Book of Dashboards: Visualizing Your Data Using Real-World Business Scenarios, and author of the upcoming book The Big Picture: How to Use Data Visualization to Make Better Decisions—Faster.
Steve has worked with ADP, Gallup, Johnson & Johnson, Deloitte, ExxonMobil, Convergys, Consumer Reports, The Economist, SurveyMonkey, Con Edison, D&B, Marist, Cornell University, Stanford University, Tradeweb, Tiffany, McKinsey & Company, and many other organizations to help them understand and visualize their data.
A winner of numerous data visualization honors and awards, Steve also serves on the advisory board to the Data Visualization Society.
His presentations and training classes combine an extraordinary level of product mastery with the real-world experience gained through developing thousands of visualizations for dozens of clients. Steve has taught thousands of people in both large and small organizations and is known for conducting his seminars with clarity, patience, and humor.

Tuesday, May 18, 2021
11:30 am cdt
[Online] Paginated Reports in an Hour
Join us *online* as we meetup again to share ideas around Power BI, Modern Excel, and Power Apps.
This month Alex Powers, Senior Program Manager of the Power BI Customer Advisory Team, joins to give us hands-on-keyboard training on paginated reports in Power BI. There are lots of occasions when paginated reports are called for over the "sliceable and diceable" reports you might be used to in Power BI, so this will be an invaluable technique in your BI toolset.
Paginated Reports in an Hour
This session will include a live hands-on-keyboard training for attendees, teaching you how to get started with creating Paginated Reports for Power BI to meet all your end user “Export-to” and Parameter based needs.
Follow Along URL: https://aka.ms/pbiworkshops
About: Alex Powers (Microsoft – Sr Program Manager)
From financial services to felines, the World Wide Web to professional wrestling – Alex Powers has an affinity for the conventional and unconventional when it comes to information. A self-proclaimed Excel and Power BI Enthusiast – Alex enjoys contributing to online forums, co-hosting the Power BI YouTube series Two Alex and sharing his passion for empowering others using Microsoft technologies.

Thursday, April 8, 2021
11:30 AM CDT
[Online] How Power Query Thinks
Join us *online* as we meetup again to share ideas around Power BI, Modern Excel, and Power Apps.
This month Ben Gribaudo is joining us to explain "How Power Query Thinks". Ben has one of the best blog series explaining the Power Query language. He has a wealth of knowledge about software development and data engineering, and you will not want to miss this talk if you want to learn more about Power Query.
How Power Query Thinks: Taking the Mystery Out of Streaming and Query Folding
How does Power Query’s mashup engine process the expressions you write? Query folding is one key concept—where behind the scenes, the engine may transform part or all of your M code into the data source’s native query language then ask the source to execute that query. Streaming, though perhaps a less familiar term, is even more fundamental, as it describes how table, list and binary data flows between functions in M.
Let’s take the mystery out of these two terms—but before we get to them, we’ll lay a foundation of basic concepts about how the Power Query language works. Altogether, the goal of our time together is to give you an understanding of How Power Query Thinks, so you can write more efficient mashups, are better positioned to debug problems, and can avoid unexpected variability in results.

Thursday, March 11, 2021
11:30 am cst
[Online] Building a Data Culture with Power BI
Join us *online* as we meetup again to share ideas around Power BI, Modern Excel, and Power Apps.
Succeeding with business intelligence involves technical skill and deep understanding of the business problems being solved. With traditional BI tools, delivering solutions typically requires collaboration between technical data professionals and business professionals. With modern self-service BI tools like Power BI, business professionals are empowered to produce more with less IT involvement, but success still requires efficient collaboration between business and IT. There is no one "right" or "best" way to deliver managed self-service capabilities, but there are common patterns and approaches that successful teams apply. Some companies have found the right balance - some are still struggling.
In this insight-packed session, Matthew Roche from the Power BI CAT team will present guidance on creating and maintaining a data culture, and establishing a successful center of excellence for delivering managed self-service business intelligence using Power BI. This guidance will be distilled from patterns and practices learned from engagements with over 150 global enterprise organizations that are using Power BI as their enterprise BI platform.
If you're struggling with challenges from self-service BI, if you're tasked with establishing a BI center of excellence and don't want to reinvent the wheel, if you want to help establish a sustainable data culture within your organization - or if you just want a head start to understanding the road ahead, join Matthew to learn from those who have gone down that road before you.
Matthew Roche is a Principal Program Manager in Microsoft’s Cloud + AI Group, where he focuses on data culture, business intelligence, enterprise information management, metadata, and data warehousing.
Matthew is currently a member of the Power BI CAT team, where he was saddened to learn that there were not actually any cats. Previously Matthew has worked on Azure Data Catalog, SQL Server Integration Services, Master Data Services, and Data Quality Services. Before joining Microsoft, he worked as an architect, consultant, and trainer focusing on ETL, data warehousing, and business intelligence.
When he’s not enabling the world to get more value from its data, Matthew enjoys reading, baking, heavy metal, and competitive longsword combat.

Tuesday, February 16, 2021
11:30 AM CST
[Online] Power BI Time Intelligence – Beyond the Basics
Join us *online* as we meetup again to share ideas around Power BI, Modern Excel, and Power Apps.
Time Intelligence refers to analyzing calculations and metrics across time and is the most common type of business intelligence reporting. Power BI has a lot of built in capabilities to help you get started but these alone are not enough for most real-world solutions.
The key to mastering time-intelligence in Power BI is a good date table and understanding how to control the filter context. This session will teach you about both!
In this (demo-heavy) session, we’ll quickly review Power BI’s built-in time intelligence capabilities and why you should avoid them! We’ll also cover the importance of a good date table, what attributes it should include, and how it can be leveraged to simplify complex time-intelligence calculations. Finally, we’ll breakdown many of the 40+ DAX time-intelligence functions, showing you how they work under the covers (hint: filter context) and how they can be used in combination to accommodate complex business logic.
Bill Anton is an expert in Analysis Services and an experienced data warehouse practitioner. In 2013, he founded Opifex Solutions, a consulting firm with deep expertise in enterprise-scale architecture, design, and performance optimization of Analysis Services and Power BI solutions. He loves eating and spends most of his free time convincing his beloved wife to adopt more golden retrievers.

Thursday, January 21, 2021
11:30 am cst
[Online] Practical Application of Storytelling Techniques in Power BI
Join us *online* as we meetup again to share ideas around Power BI, Modern Excel, and Power Apps.
In data visualization, we are inundated with the idea that we should be telling a story. But what is a story? And how do you use visual properties and navigation to tell a story? Join Meagan Longoria for this discussion of storytelling in data visualization and demonstration of storytelling techniques.
Meagan Longoria is a business intelligence consultant with Denny Cherry & Associates who lives in Denver, Colorado. She is a Microsoft Data Platform MVP. Meagan spends a lot of time thinking about how to use data integration, DAX, and data visualization techniques to make data useful for people. She enjoys sharing her knowledge and experiences at conferences and user group meetings, as well as through her blog (DataSavvy.me).

Thursday, December 10, 2020
11:30 AM CST
[Online] Using Calculation Groups in DAX
Calculation groups are the most important feature introduced in DAX after variables in 2015. By using calculation groups, you can apply transformations to existing measures without having to create new measures in the model. For example, you can define the year-over-year calculation once and apply it to all the measures you want. Yet, calculation groups can do more than that.
This session introduces the syntax of calculation groups, when they should be used and several examples of use cases. You will also learn how calculation groups work internally and what are the limits of this amazing tool.
Alberto started working with SQL Server in 2000 and immediately his interest focused on Business Intelligence. He and Marco Russo created sqlbi.com, where they publish extensive content about Business Intelligence.
Alberto published several books about Analysis Services, Power BI, and Power Pivot. He is a Microsoft MVP and he earned the SSAS Maestro title, the highest level of certification on Microsoft Analysis Services technology.
Today, Alberto's main activities are in the delivery of DAX and data modeling workshops for Power BI and Analysis Services all around the world. Alberto offers consulting services on large and complex data warehouses to provide assessments and validation of project analysis or to perform specific problem-solving activities.
Alberto is a well-known speaker at many international conferences, like PASS Summit, Sqlbits, and Microsoft Ignite. He loves to be on stage both at large events and at smaller user groups meetings, exchanging ideas with other SQL and BI fans. When traveling for work, he likes to engage with local user groups to provide evening sessions about his favorite topics. Thus, you can easily meet Alberto by looking up local Power BI user groups during scheduled courses.
Outside of SQLBI, most of Alberto's personal time is spent practicing video games, in the vain hope of eventually beating his son.

Tuesday, November 17, 2020
11:30 AM CST
[Online] Source Control* with Power BI
Join us *online* as we meetup again to share ideas around Power BI, Modern Excel, and Power Apps. We will be hearing from William Butler, Senior Data Architect at myNEXUS, about leveraging Teams, SharePoint, and Power BI to protect your time and energy without losing productivity.

Thursday, October 15, 2020
11:30 AM CDT
[Online] Meyers Briggs Personality Types You Find In A Self-Service BI Platform
Join us online for a terrific presentation by Microsoft MVP Chris Wagner,
Analytics Architect, Mentor, Leader, and Visionary.
Chris has been working in the Data and Analytics space for nearly 20 years. Chris has dedicated his professional career to making data and information accessible to the masses. A significant component in making data available is continually learning new things and teaching others from these experiences. To help people keep up with this ever-changing landscape, Chris frequently posts on LinkedIn and to his blog.
Come hear a talk you've likely never heard anywhere else: The Meyers Briggs Personality Types You Find in a Self-Service BI Platform. Chris will walk you through how people's different personality traits impact their relationship with data, and what that means for the creators of self-service BI solutions.
The talk is free, virtual, and open to the public. Just sign up and join the Zoom conference on Thursday, October 15, at 11:30 AM Central.
Thursday, September 10, 2020
11:30 AM CDT
[Online] Power BI Desktop and AI or “There's AI in in the Power BI Desktop?”
Yes, there is AI built right into the Microsoft Power BI Desktop. This session will guide you through adding more Intelligence to your BI reports!
Power BI is masterful at helping designers create storytelling reports that provide answers to the questions of “What has happened?” and “What is happing right now?” We can even get some insight as to “What will happen?” BUT what if you want to know “Why something happened? Or “How can we alter what will happen?” With the built in AI tools, we can start the journey of getting our “Why” and “How” questions answered.
In this session we will review the following Power BI Desktop tools:
* Q&A Tooling
* Explain the Increase / Decrease (Insights)
* Key Influencers Visual
* Decomposition Tree Visual

Tuesday, August 18, 2020
11:30 AM CDT
[Online] Guiding User Experiences With Advanced Reporting Features
As Power BI continues to innovate with new features that enhance the user experience, it is more important than ever to understand what's available to configure for the report consumer experience. Learn about advanced features such as: bookmark capture states and uses, button configurations and formatting, report tooltip applications, and the wide applicability of measure based formatting. Come listen to Reid Havens help you take your Power BI techniques to the next level.
Reid is the founder of Havens Consulting Inc. and is a Microsoft Most Valued Professional (MVP). He has an extensive background in technology and organizational management, and has obtained a Master's Degree in Organizational Development and Business Analytics. He has experience as a consultant working with many Fortune 50, 100, and 500 companies. Additionally, he teaches Business Intelligence, reporting, and data visualization courses at the University of Washington and other universities.
Reid is also an avid content developer. He has authored numerous videos and articles on multiple video platforms and blog sites. He has also developed multiple training curriculums that have been delivered to numerous companies around the world. In addition to corporate trainings, he has also developed college level curriculum for the University of Washington and other universities.